


CAT Logical Reasoning Questions
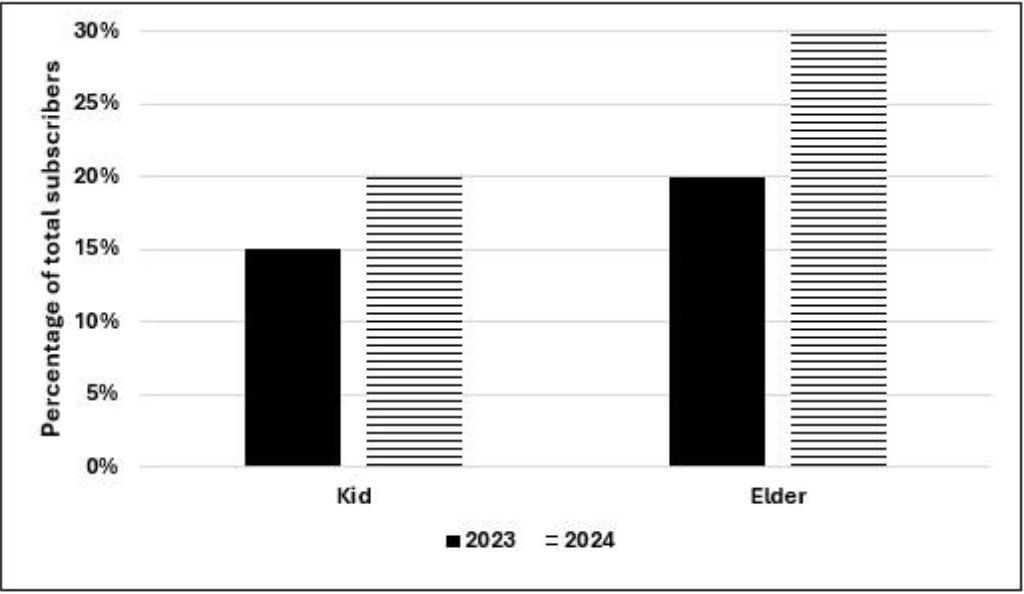
Over the top (OTT) subscribers of a platform are segregated into three categories: i) Kid, ii)
Elder, and iii) Others. Some of the subscribers used one app and the others used multiple
apps to access the platform. The figure below shows the percentage of the total number of
subscribers in 2023 and 2024 who belong to the ‘Kid’ and ‘Elder’ categories.
The following additional facts are known about the numbers of subscribers.
1. The total number of subscribers increased by 10% from 2023 to 2024.
2. In 2024, 1/2 of the subscribers from the ‘Kid’ category and 2/3 of the subscribers from the
‘Elder’ category subscribers use one app.
3. In 2023, the number of subscribers from the ‘Kid’ category who used multiple apps was the
same as the number of subscribers from the ‘Elder’ category who used one app.
4. 10,000 subscribers from the ‘Kid’ category used one app and 15,000 subscribers from the
‘Elder’ category used multiple apps in 2023
How many subscribers belonged to the ‘Others’ category in 2024?
What percentage of subscribers in the ‘Kid’ category used multiple apps in 2023?
What was the percentage increase in the number of subscribers in the ‘Elder’ category
from 2023 to 2024?
What could be the minimum percentage of subscribers who used multiple apps in
2024?
The air-conditioner (AC) in a large room can be operated either in REGULAR mode or in
POWER mode to reduce the temperature.
If the AC operates in REGULAR mode, then it brings down the temperature inside the room
(called inside temperature) at a constant rate to the set temperature in 1 hour. If it operates in
POWER mode, then this is achieved in 30 minutes.
If the AC is switched off, then the inside temperature rises at a constant rate so as to reach
the temperature outside at the time of switching off in 1 hour.
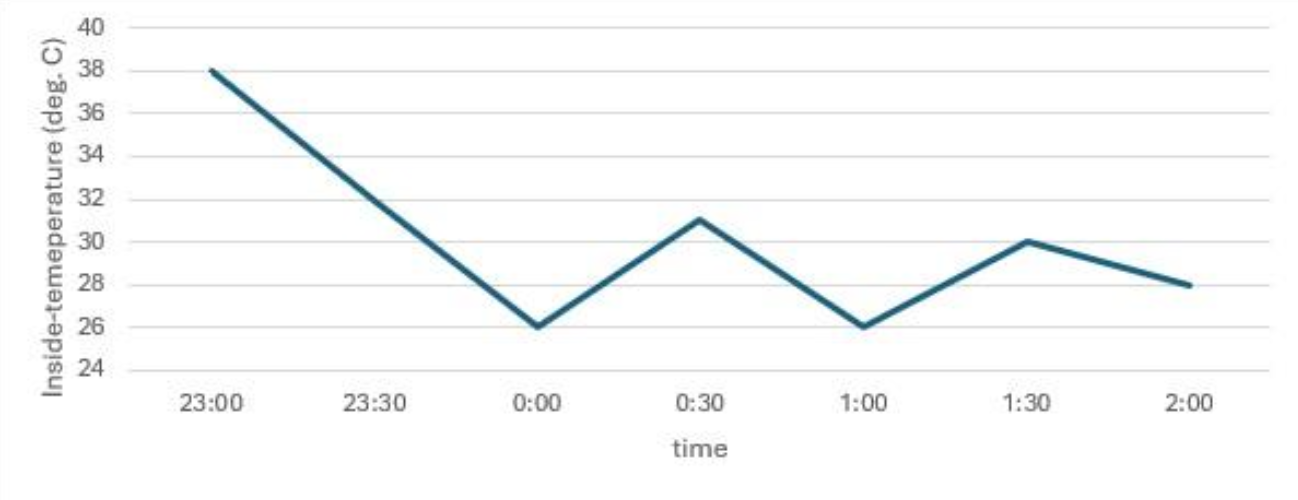
The temperature outside has been falling at a constant rate from 7 pm onward until 3 am on a
particular night. The following graph shows the inside temperature between 11 pm (23:00)
and 2 am (2:00) that night.
The following facts are known about the AC operation that night.
• The AC was turned on for the first time that night at 11 pm (23:00).
• The AC setting was changed (including turning it on/off, and/or setting different
temperatures) only at the beginning of the hour or at 30 minutes after the hour.
• The AC was used in POWER mode for longer duration than in REGULAR mode during this
3-hour period.
How many times the AC must have been turned off between 11:01 pm and 1:59 am?
What was the temperature outside, in degree Celsius, at 1 am?
What was the temperature outside, in degree Celsius, at 9 pm?
What best can be concluded about the number of times the AC must have either been
turned on or the AC temperature setting been altered between 11:01 pm and 1:59 am?
What was the maximum difference between temperature outside and inside
temperature, in degree Celsius, between 11:01 pm and 1:59 am?
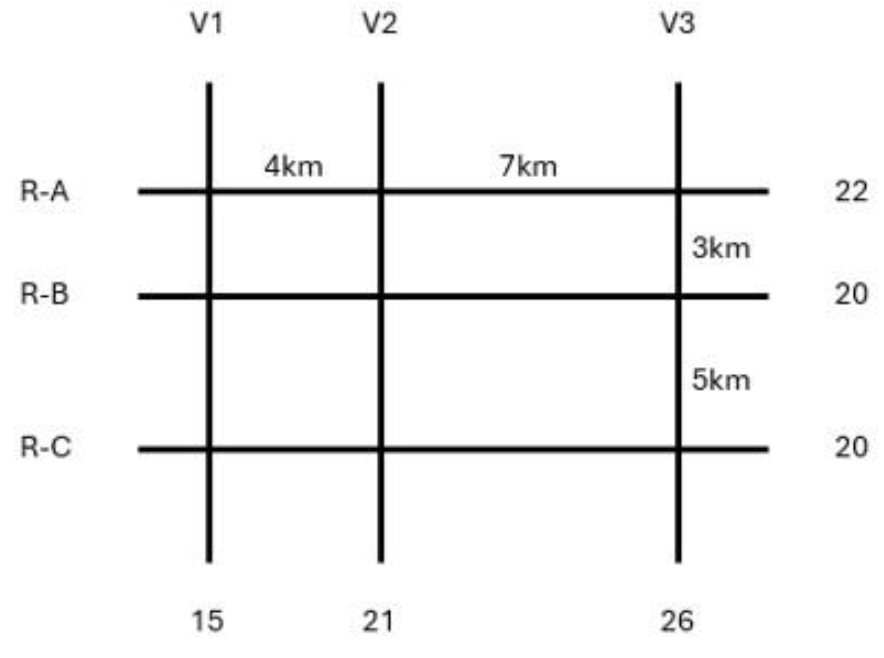
The figure below shows a network with three parallel roads
represented by horizontal lines R-A, R-B, and R-C and another three
parallel roads represented by vertical lines V1, V2, and V3. The figure
also shows the distance (in km) between two adjacent intersections.
Six ATMs are placed at six of the nine road intersections. Each ATM
has a distinct integer cash requirement (in Rs. Lakhs), and the
numbers at the end of each line in the figure indicate the total cash
requirements of all ATMs placed on the corresponding road. For
example, the total cash requirement of the ATM(s) placed on road R-A
is Rs. 22 Lakhs.
The following additional information is known.
1. The ATMs with the minimum and maximum cash requirements of
Rs. 7 Lakhs and Rs. 15 Lakhs are placed on the same road.
2. The road distance between the ATM with the second highest cash
requirement and the ATM located at the intersection of R-C and V3 is
12 km.
Which of the following statements is correct?
How many ATMs have cash requirements of Rs. 10 Lakhs or more?
Which of the following two statements is/are DEFINITELY true?
Statement A: Each of R-A, R-B, and R-C has two ATMs.
Statement B: Each of V1, V2, and V3 has two ATMs.
What best can be said about the road distance (in km) between the ATMs having the
second highest and the second lowest cash requirements?
What is the number of ATMs whose locations and cash requirements can both be
uniquely determined?
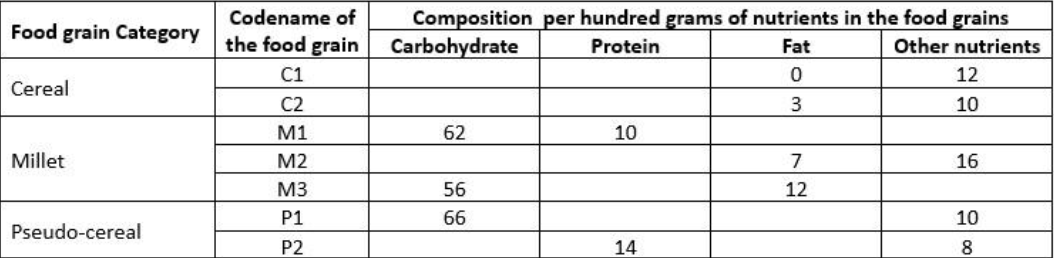
The table given below shows the amount, in grams, of carbohydrate, protein, fat and all
other nutrients, per 100 grams of nutrients in seven foodgrains. The first column shows the
foodgrain category and the second column its codename. The table has some missing
values.
The following additional facts are known.
1. Both the pseudo-cereals had higher amounts of carbohydrate as well as higher amounts
of protein than any millet.
2. Both the cereals had higher amounts of carbohydrate than any pseudo-cereal.
3. All the missing values of carbohydrate amounts (in grams) for all the foodgrains are non-
zero multiples of 5.
4. All the missing values of protein, fat and other nutrients amounts (in grams) for all the
foodgrains are non-zero multiples of 4.
5. P1 contained double the amount of protein that M3 contains.
How many foodgrains had a higher amount of carbohydrate per 100 grams of
nutrients than M1?
How many grams of protein were there in 100 grams of nutrients in M2?
How many grams of other nutrients were there in 100 grams of nutrients in M3?
What is the median of the number of grams of protein in 100 grams of nutrients
among these food grains?
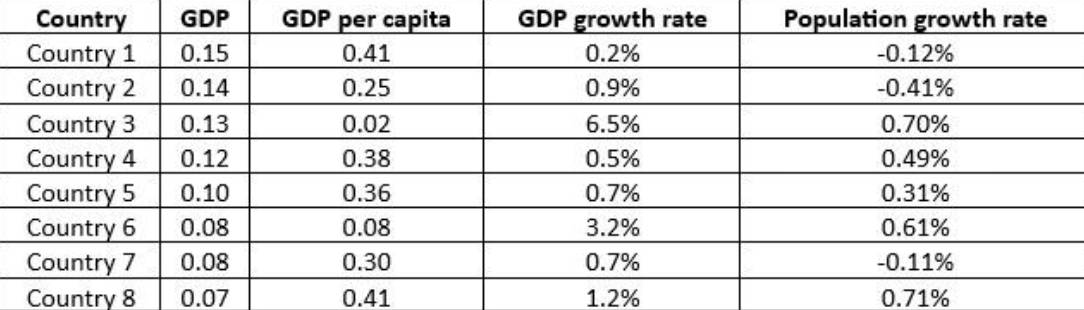
Out of 10 countries -- Country 1 through Country 10 -- Country 9 has the highest gross
domestic product (GDP), and Country 10 has the highest GDP per capita. GDP per capita is
the GDP of a country divided by its population. The table below provides the following data
about Country 1 through Country 8 for the year 2024.
• Column 1 gives the country's identity.
• Column 2 gives the country’s GDP as a fraction of the GDP of Country 9.
• Column 3 gives the country’s GDP per capita as a fraction of the GDP per capita of Country
10.
• Column 4 gives the country’s annual GDP growth rate.
• Column 5 gives the country’s annual population growth rate.
Assume that the GDP growth rates and population growth rates of the countries will remain
constant for the next three years.
Which one among the countries 1 through 8, has the smallest population in 2024?
The ratio of Country 4’s GDP to Country 5’s GDP in 2026 will be closest to
Which one among the countries 1, 4, 5, and 7 will have the largest population in 2027?
For how many countries among Country 1 through Country 8 will the GDP per
capita in 2027 be lower than that in 2024?